
Diya Infotech provides dashboard development services that help businesses visualize data clearly and track performance in real time. Our dashboards transform complex data into intuitive views, enabling faster insights, better monitoring, and informed decision-making.
Dashboard Development Services
- Interactive and user-friendly dashboards
- Real-time data visualization and updates
- Custom KPIs and performance metrics
- Clear charts, graphs, and reports
- Dashboards tailored to business needs
Smart Dashboards for Clear Business Decisions
Dashboards turn raw data into visual clarity, helping businesses monitor performance, track key metrics, and understand trends at a glance without digging through complex reports.
In today’s data-heavy environments, dashboards play a critical role in making information accessible and actionable. Well-designed dashboards consolidate data from multiple sources, present it in real time, and highlight what matters most. Instead of static reports, teams gain continuous visibility into KPIs, progress, and exceptions, enabling faster responses, better alignment, and improved operational control across departments.
At Diya Infotech, we design dashboards that balance clarity, usability, and business relevance. Our team focuses on meaningful visualizations, accurate data representation, and intuitive layouts tailored to specific roles and goals. By aligning dashboards with decision-making needs, we help organizations track performance effectively, identify issues early, and support data-driven planning and execution.
WHY CHOOSE US
What Sets Us Apart
Accuracy
Delivers clean, reliable data you can trust every time.
Scalability
Handles any data volume smoothly without slowdown.
Global Reach
Captures insights from markets across the world.
Real-Time APIs
Provides instant, up-to-date data on demand.
Compliance First
Ensures all data practices meet global standards.
Dedicated Support
Project-based dedicated support 24*7.
Comprehensive Dashboard Development Services
Requirement Mapping
We understand business goals, KPIs, and user roles to define what data needs to be visualized and how it should support decision-making.
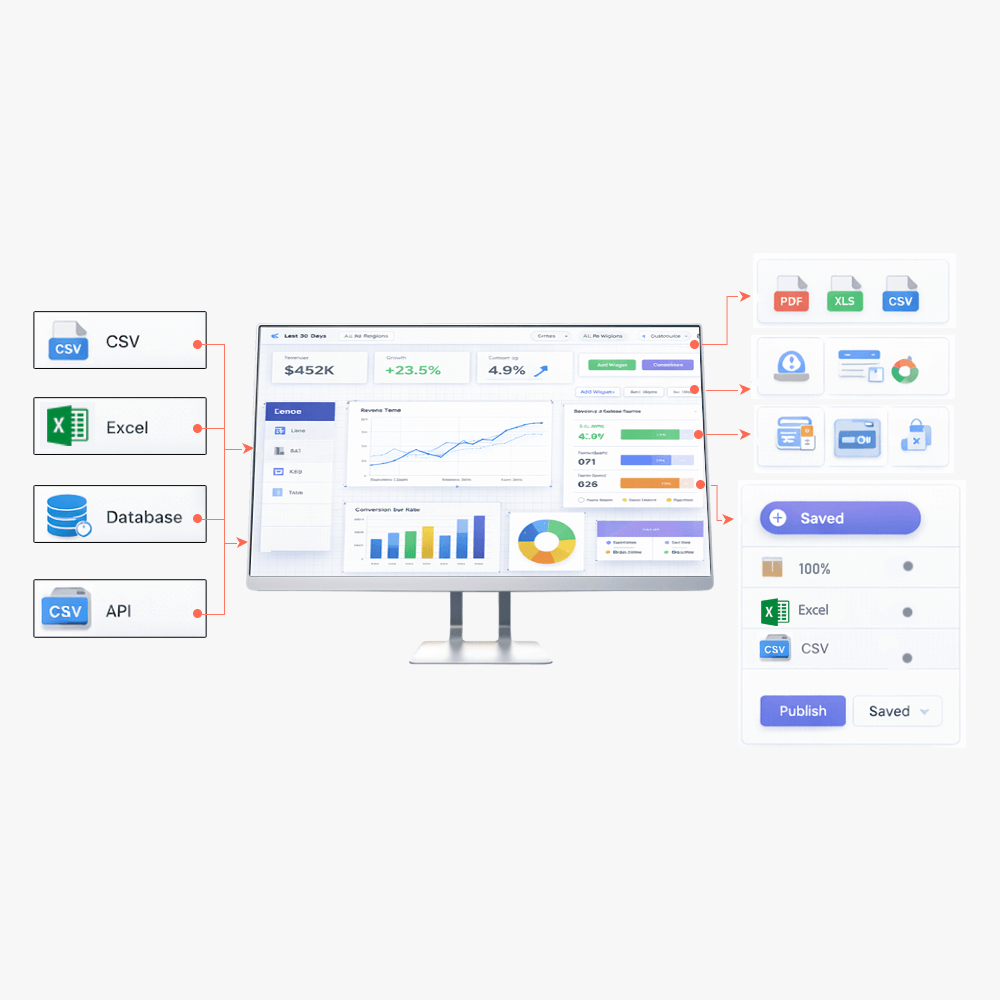
Data Integration
We connect dashboards with multiple data sources to ensure consistent, accurate, and up-to-date information across systems.
KPI Design
We design meaningful KPIs and metrics that align with business objectives and help teams track performance effectively.
Visual Design
Dashboards are built with clear charts, graphs, and layouts that make complex data easy to understand at a glance.
Interactive Views
We enable filters, drill-downs, and dynamic views so users can explore data and gain deeper insights as needed.
Performance Optimization
Dashboards are optimized for speed, responsiveness, and reliability to support real-time monitoring and smooth user experience.
Advantages of Dashboard Development
01
Clear Visibility
Dashboards present data in a visual and organized way, making it easier to understand performance, trends, and key metrics at a glance.
02
Real-Time Insights
Live data updates ensure teams are always working with current information, enabling quicker responses to changes and issues.
03
Faster Decisions
By reducing time spent analyzing reports, dashboards help decision-makers act quickly based on clear and relevant insights.
04
Improved Alignment
Shared dashboards keep teams aligned around common KPIs and objectives, improving collaboration and accountability.
05
Performance Tracking
Dashboards make it easy to monitor progress, compare results, and identify areas that need improvement.
06
Actionable Insights
Well-designed dashboards highlight what matters most, helping businesses focus on actions that drive results.
Use Cases for Dashboard Development
Executive Reporting
Dashboards provide leadership teams with a consolidated view of business performance, enabling quick understanding of progress, risks, and opportunities without deep data analysis.
- Track high-level KPIs and business metrics
- Monitor revenue, growth, and profitability
- View performance across departments
- Identify risks and exceptions early
- Support strategic and board-level decisions
Operational Monitoring
Operational dashboards help teams track day-to-day activities and process performance in real time.
- Monitor operational KPIs and workflows
- Track efficiency, output, and turnaround times
- Identify bottlenecks and delays
- Improve process control and visibility
- Support continuous operational improvement
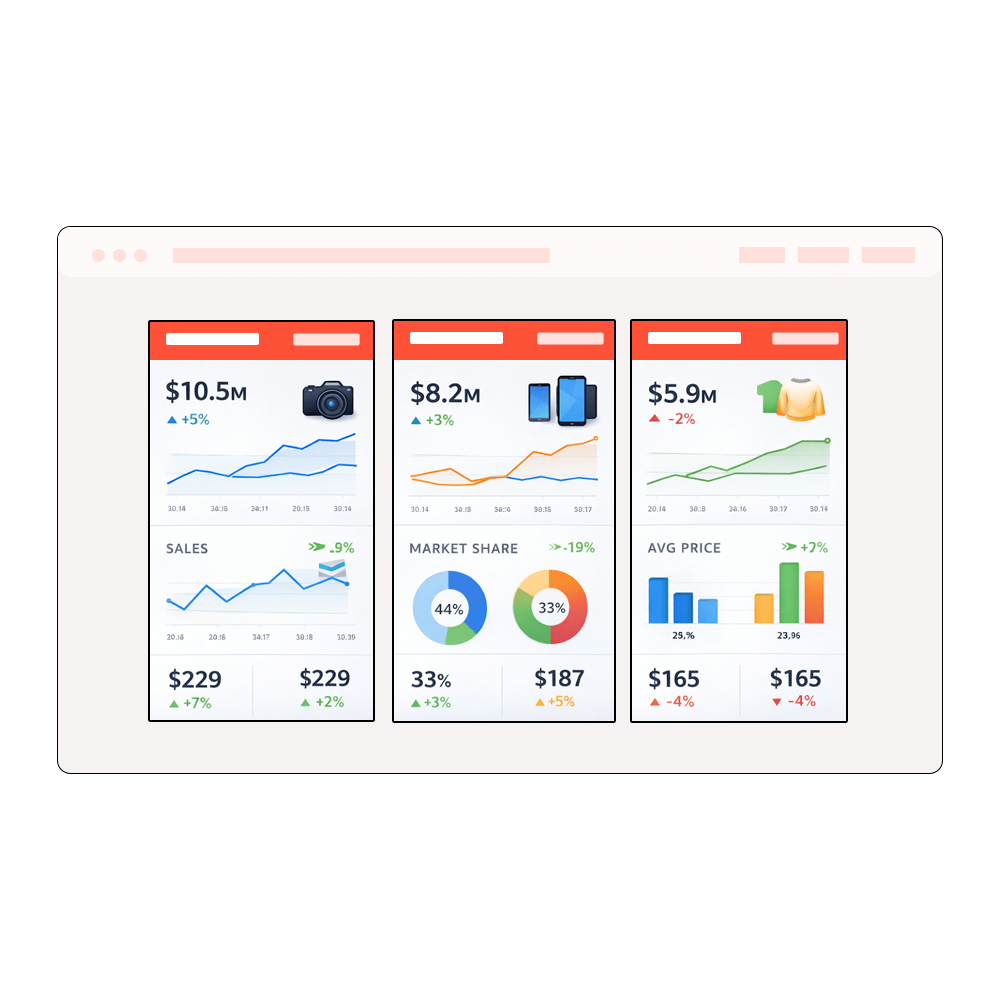
Sales Performance
Sales dashboards enable teams to track pipeline health, targets, and conversion metrics clearly.
- Monitor sales pipeline and deal stages
- Track targets vs actual performance
- Analyze conversion rates and trends
- Identify top-performing products or regions
- Support data-driven sales planning
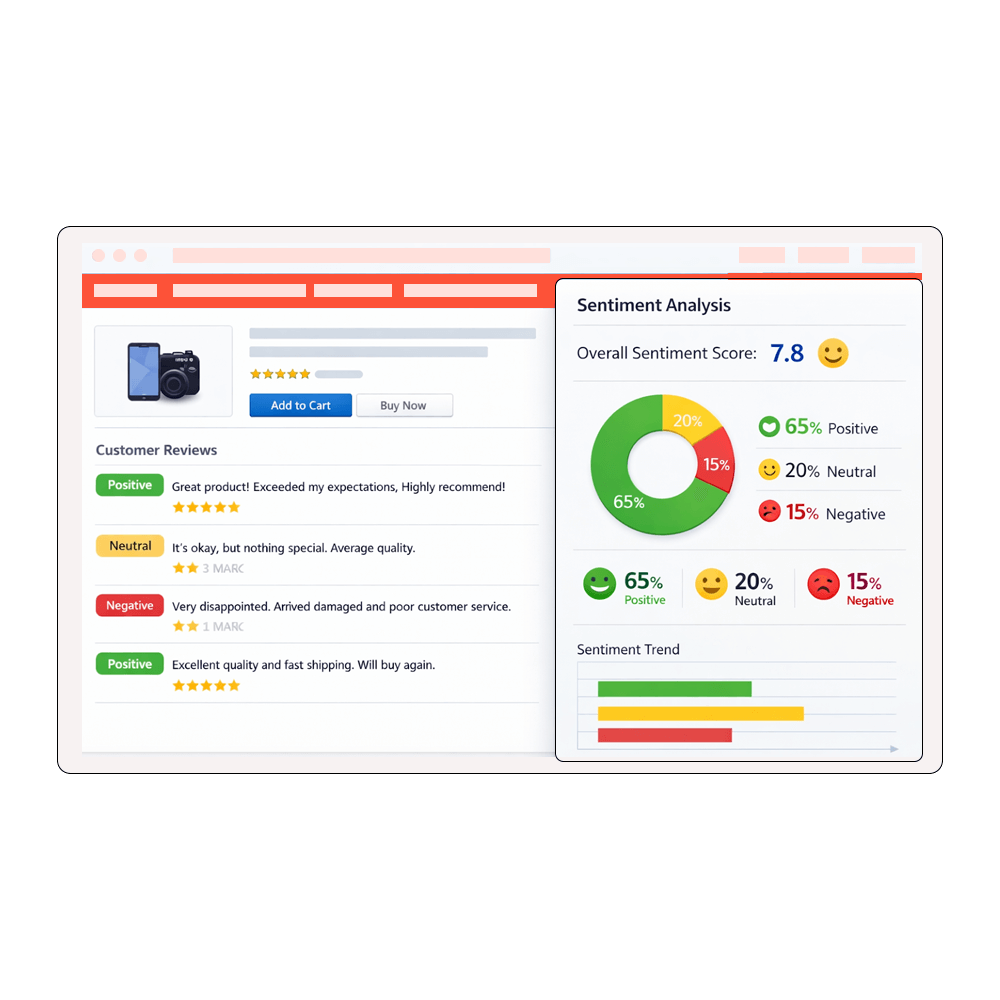
Marketing Analytics
Marketing dashboards bring together campaign, channel, and engagement data for performance evaluation.
- Track campaign performance and ROI
- Monitor leads, conversions, and engagement
- Compare channels and initiatives
- Identify high-performing strategies
- Optimize marketing spend and efforts
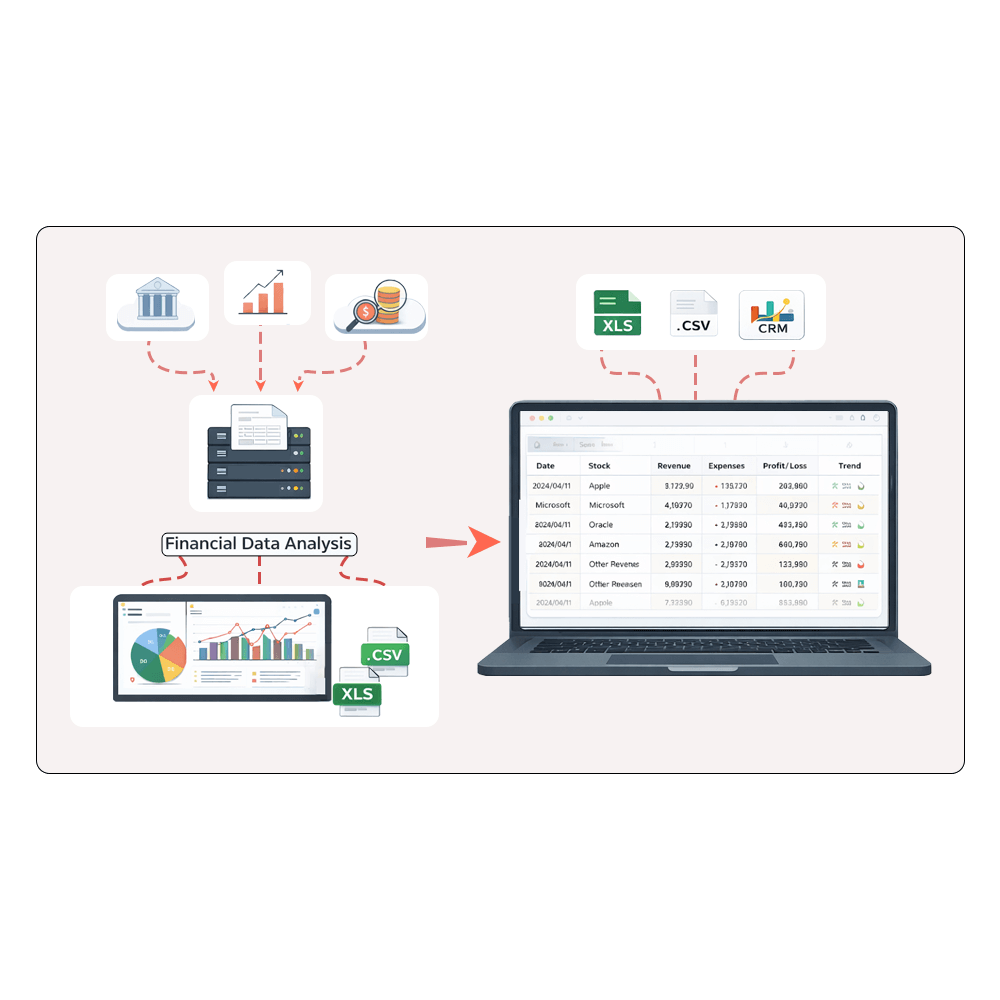
Financial Analysis
Financial dashboards provide clear visibility into financial health and performance.
- Monitor revenue, costs, and margins
- Track budgets and forecasts
- Analyze financial trends over time
- Identify variances and risks
- Support financial planning and control
Popular Website or Application Data Scraping
Food Delivery
- Doordash
- Swiggy
- Deliveroo
- Wolt
- Uber Eats
- Glovo
- Zomato
- Foodpanda
- Justeat
- Grubhub
OTT Platforms
- Netflix
- Hotstar
- Disney+
- Hulu
- Apple Tv
- Amazon Prime
- Sky
- Pluto Tv
- Dazn
- Discovery
Social Media
- FB/Insta
- YouTube
- TikTok
- X/Twitter
- Snapchat
- Quora
Hotel
- Airbnb
- Booking.com
- Ctrip
- MakeMyTrip
- Trivago
- TripAdvisor
- Expedia
- Agoda
- Priceline
- Google Travel
Recruitment
- Amazon Jobs
- Indeed
- Usajobs
- Glassdoor
- Ziprecrutier
- Monster
- Dice
- Roberthalf
- Snagajob
- Simplyhired
Dating
- Tinder
- Salt
- Her
- Eharmony
- Badoo
- Bumble
- Okcupid
- Hinge
- SilverSingles
- Match.com
NEED CLARITY?
Frequently Asked Questions
What dashboard development services does Diya Infotech provide?
Diya Infotech designs and develops custom dashboards that visualize business data clearly, helping teams track KPIs, monitor performance, and make informed decisions using accurate, well-structured data.
Do you build dashboards based on our business requirements?
Yes. Every dashboard is built based on your business goals, KPIs, user roles, and reporting needs to ensure the visuals support real decision-making.
Can Diya Infotech integrate multiple data sources into one dashboard?
Yes. We integrate data from databases, spreadsheets, APIs, CRM systems, and other business tools to create a single, unified view of your data.
Do you provide role-based dashboards for different teams?
Yes. We create dashboards tailored for executives, operations, sales, marketing, finance, or analytics teams, with metrics relevant to each role.
Are the dashboards interactive?
Yes. Our dashboards can include filters, drill-downs, and dynamic views so users can explore data in detail without technical complexity.
How do you ensure data accuracy in dashboards?
We validate and structure data before visualization, ensuring dashboards reflect accurate, consistent, and reliable information aligned with your source systems.
Can dashboards be updated as business needs change?
Yes. We support updates to KPIs, visuals, data sources, and layout as your reporting needs evolve over time.
Is data security maintained during dashboard development?
Yes. We follow strict data handling practices and implement access controls to ensure dashboards remain secure and confidential.
WHAT WE OFFER
Our Other Services


Get In Touch
We are your preferred data services partner. Our commitment to your success begins when you fill up this form and send it to us.
What's Next ?
You have made the right choice by connecting with us for your data extraction requirements. The below process how to get started.