Do you know what your competitors are doing? If not, you are lagging when it comes to cut-throat competition.
It is crucial for businesses to know their competitors’ strategies, products, pricings, market trends, and other crucial insights. With such information at your sleeves, you can make smart decisions for your business growth.
A survey from Emerald.com reveals that 90% of Fortune 500 companies already use competitive intelligence to gain a competitive advantage.
Furthermore, another research from TechJury reveals that competitive intelligence makes smart decision-making 5 times faster.
Building a competitive intelligence dashboard helps you understand what your competitors are up to. Not just that, it offers a plethora of benefits to you to make smart, data-driven decisions.
In industries like real estate, eCommerce, entertainment, travel, and food delivery, competitive analysis can open a Pandora box of benefits for you.
All you need to do is to hire a professional data analytics services provider company to build a comprehensive and customized competitive analysis dashboard for your business.
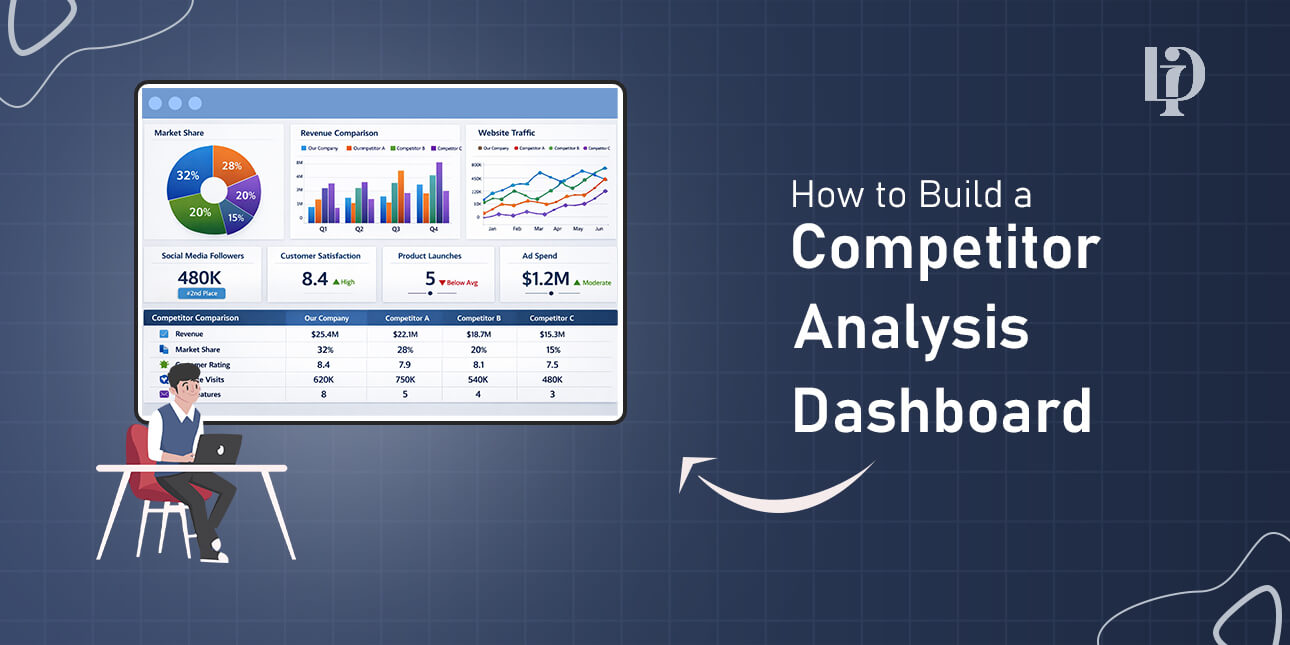
What is a Competitor Analysis Dashboard?
A competitor analysis dashboard is like a centralized, interactive, customized, and scalable command center or platform. With a competitor dashboard, businesses can collect, process, structure, and visualize competitor data in friendly formats and make business-friendly decisions.
It collects and processes data from various sources like competitor websites, forums, online sources, competitor social media platforms, and review platforms. In addition, it transforms raw, unstructured data into actionable insights, facilitating businesses monitor key metrics, such as product features, pricings, discounts, promotional offers, new product launches, reviews & ratings, and other vital details.
One of the most important benefits of competitor dashboards is their ability to democratize data. Users can analyze data in a simplified format to make actionable decisions. It reduces the time spent on manual research by 70%, saving costs and resources associated with it.
Read For Understand: What is an Analytics Dashboard? Key Types & Examples
Why Do You Need a Competitor Analysis Dashboard?
Let’s imagine that you don’t have a competitive dashboard. What will happen in that case? It is simple. Your competitor analysis process will be slow, manual, with errors, and without accurate and actionable insights.
On the other hand, a competitor analysis dashboard offers some critical advantages to businesses. Some of them are:
- Proactive Decision-Making: Your competitor strategy will not be reactive, but proactive. You will be able to predict their moves when you have actionable insights on their product pricings, product launch, and promotional offers.
- Strategic Pricing: By keeping a close eye on competitors’ product prices, you will be able to amend your pricing strategy in real-time, attracting more customers.
- Product Gap Identification: Spot customer pain points and find the service gaps, product attributes, and stock-outs to reach out to customers.
- Market Share Signals: You will be able to track and monitor ratings, reviews, search rankings, and other insights to gauge shifts in consumer preference and expectations.
- Better Promotional Offers: By keeping an eye on competitors’ promotional offers and discounts, you will refine your own promotion strategy to invite more consumers.
What Are the Steps to Build a Comprehensive Competitor Analysis Dashboard?

To build an inclusive and robust competitor analysis dashboard, you need to follow a battle-tested process that brings desired results. We have discussed all the steps in detail to give you a full understanding.
Step 1: Identification of Sources
The first step discusses the identification and accuracy of data sources. Here, you need to define the data sources from which you want to perform data extraction.
| Platform Category | Source Examples | Data Relevance |
| Direct Competition | Competitor websites, mobile apps, | Pricing, Product Catalog, Availability, Promotion Offers. |
| Marketplaces | eBay, Amazon, Alibaba, and other marketplaces | Seller Performance, Reviews & Ratings, Market Share, Fulfillment |
| Review Platforms | Trustpilot, Google Maps, App Stores, G2, Capterra | Product/Service Sentiment, Customer Pain Points, Strengths/Weaknesses |
| Social Media Platforms | Twitter, Instagram, Tiktok, Facebook, LinkedIn, Pinterest, Reddit, Quora | Marketing Campaigns, Brand Sentiment, Customer Engagement |
| Comparison Portals | PriceRunner, Google Shopping, Kayak (for travel) | Aggregate Pricing, Product Ranking, Search Presence |
Step 2: Identification of Data Attributes and KPIs
Once you have determined data sources, the next thing to do is to identify key data attributes and Key Performance Indicators (KPIs).
| Data Attributes | Description | KPIs |
| Pricing & Discounts | Base prices, sales prices, discounts, bundle pricing, changes in the pricing strategy | Competitor Price Index |
| Product Catalog Attributes | Product name, SKU, specifications (e.g., color, size, material), images, descriptions. | Catalog Attribute Completeness & Differentiation (CACD) Score |
| Availability/Stock Status | “In Stock,” “Out of Stock,” estimated shipping time, backorder status. | Stock-Out Rate (Percentage of a competitor’s key catalog that is out of stock) |
| Promotions | Ad copy, duration, channel (e.g., “Free Shipping over $50,” “20% off first order”). | Promotional Intensity Index, tracking the average discount depth (percentage off) or the frequency of promotional campaigns over a given period |
| Ratings & Reviews | Average rating, total number of reviews, review text, sentiment analysis. | Net Promoter Score (NPS) Equivalent derived from review sentiment analysis |
| Market Share Signals | Search engine rankings, social media follower count, engagement rates. | Brand Momentum Index |
| Website/App Feature Changes | New checkout flow, updated return policy, use of new technologies (e.g., AR/VR). | UX/Feature Gap Score |
Step 3: Setting Up Crawling & Data Extraction Infrastructure
Setting up a robust infrastructure for a competitive intelligence dashboard is vital for consistent, accurate, and efficient data extraction.
Infrastructure Components:
- Automated Crawlers/Scrapers: Here, developers will build custom scripts using Python with Scrapy or PlayWright and then configure those scripts to mimic human behavior and systematically navigate websites to extract data points.
- APIs: APIs are not available for all data sources. Mostly, they are available for social media platforms and public data portals. Developers can use a direct API to extract data as it is way faster and more stable than scraping.
- Monitoring Scripts: Monitoring scripts are developed and lightweight tools are set up to detect subtle changes like price changes. You don’t need to run a full crawl.
Key Operational Considerations
- Scalability: Make sure that you develop infrastructure that can accommodate more competitor numbers and more data in the future. Businesses can go for cloud-based serverless functions to meet the growing data extraction demands.
- Frequency of Extraction: sometimes, you might need to check high-value data like pricing and stock hourly. You need to configure the scheduler accordingly.
- Proxy Management: Make sure to avoid being blocked by anti-bot systems. You can use a rotating pool of residential or data center proxies.
- Anti-Bot Handling: You can employ different techniques to bypass common defences like human-like browsing patterns, third-party services for CAPTCHAs, and setting correct HTTP headers.
Step 4: Data Quality Check & Normalization
What you will receive from data sources is raw, unstructured, and inconsistent data. Hence, the importance of this step increases to meet data accuracy and data quality. There are certain data validation techniques that you can use for a competitive analysis dashboard.
Some of them are:
- De-Duplication: Sometimes, the dashboard might extract identical records during multiple extractions. You need to remove such identical records by using a combination of unique identifiers.
- Error Handling: to handle errors, you will be required to implement robust logging and retry mechanisms if extraction failures occur.
- Standardizing Categories, Units, and Formats: Standardizing different categories, units and formats help structure data. Some of the examples are categories (Men’s formal wear), Units (all prices in USD, and all weights to kilograms), Formats (ensuring consistency in different attributes like date format in DD/MM/YY).
- Normalizing Attributes Across Multiple Competitors: Multiple competitors name different attributes differently and you need to normalize them into a single internal field. It will help you to compare attributes accurately on the dashboard.
- Creating a Clean and Structured Dataset: Now, you have a clean and structured database that is ready for analysis and dashboard ingestion.
Step 5: Dashboard Wireframe on Figma
The next step is to create a wireframe on Figma. It will help stakeholders to look at all the features and components of the competitive intelligence dashboard. It will have a clear map of the dashboard and you can check it for functionality, content, and interaction.
Here is a brief explanation of the wireframe process:
- First of all, define the user personas to determine the layout and focus of the wireframe.
- Ensure that you create a wireframe that places the most critical KPIs in prominent spots at top.
- Use different filters and navigation maps like competitor selection, time range, product category, and geography.
- Place charts and key metrics by using simple gray boxes or simple shapes to enrich the overall visualization.
- Interaction Flow must be interactive and clearly mapping a user to move from a high-level summary to a detailed breakdown.
Step 6: Final Dashboard Design Based on KPI Integration
Now, merge the clean data and the wireframe design together into a visually stunning and highly actionable dashboard.
Best Visualization Practices:
- Trend Charts: You can use a line chart to show how your KPI compares to the competition over time to highlight trajectory and momentum.
- Pricing Comparison Graphs: You can use bar charts or box plots to display the pricing comparison between multiple competitors.
- Review Sentiment Widgets: You can use gauge charts or pie charts to display the breakdown of sentiments in competitor reviews.
- Competitor Matrices: Go for a simple table view or heatmap to display different critical data points like a feature comparison table.
- Availability Heatmaps: Go for a calendar-style heatmap that can immediately show different periods when competitors were out of stock for key items.
While integrating KPIs on a competitor analysis dashboard, ensure that you keep in mind clarity, decision-making, and usability, and not aesthetics.
Step 7: Data Pipeline & Dashboard Maintenance
Creating a competitor intelligence dashboard is not a one-time project. It requires continuous maintenance and regular modifications to keep it highly relevant and accurate.
Some of the maintenance tasks are:
- Automated Pipeline Monitoring: You must set up notification alerts for any part of the data extraction pipeline that fails. For example, if a competitor’s website changes the design, you must be alerted. It will keep the data fresh and relevant.
- Daily/Weekly Extractions: Make sure that the dashboard has an active data scheduler that runs and extracts data as scheduled.
- Bug Fixes and Infrastructure Scaling: You need to keep updating scripts and review logs for scraping. Also, you must monitor server loads and scale up resources as the number of competitors or data points grow.
- Data Accuracy Monitoring: Ensure that the data you extract is accurate and precise. You need to set up checks to detect abnormal and sudden data shifts.
- Continuous Improvement & Version Updates: It is crucial for businesses to maintain the dashboard regularly to extract high-quality and accurate data. Also, make amendments in the dashboard after closely tracking feedback received from the dashboard users. Keep adding new features and functionalities and release newer versions.
Must Read: How to Hire a Data Analytics Company?
Conclusion
A competitive intelligence dashboard can help businesses make the right, data-driven, and growth-centric decisions. A dashboard with advanced features and functionalities ensure that you don’t miss anything and stay proactive in different ways. We have discussed the whole process of building a competitor dashboard that helps you keep a close eye on your competitors. Enjoy high-end competitive advantage over your rivals with a professional, feature-rich, and interactive competitive analysis dashboard.