Imagine driving a car without a speedometer, fuel, gears or navigation system. You won’t have any idea whether you’re speeding, running out of fuel, or heading in the right or wrong direction. Offcourse, you still have to drive blindly! So, would you allow that to happen? No, right!?
That’s what running a business without an analytics dashboard feels like.
Business mostly relies on analytics reports. And, dashboards handle and generate those analytic reports to help businesses track KPIs. One example is Google Analytics, which helps you track the performance of your website and pages. It helps you monitor traffic, page ranks, and several other things to help you visualise how your website is functioning or performing on the internet. It also helps you if there are any measures to take.
You must still be wondering, what actually is a dashboard in data analytics? We have this article to explain all queries related to the analytics report. In this article, we have wrapped all the information about how an analytics dashboard works for an organization and the types of dashboards that help manage the metrics and KPI’s for your organization.
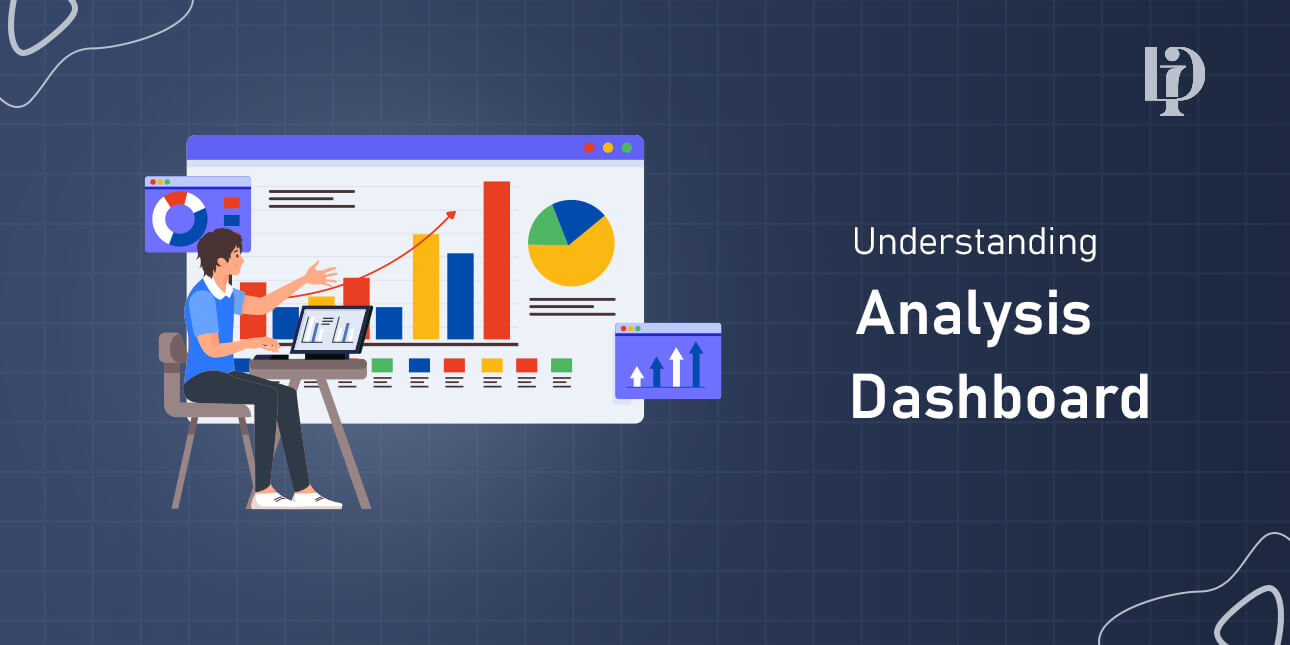
What Is An Analytic Dashboards?
If you have ever used Google Analytics, you know how easily it allows you to build a web analytics dashboard and track a real-time performance matrix related to the website. We have given a demonstration image for your reference.
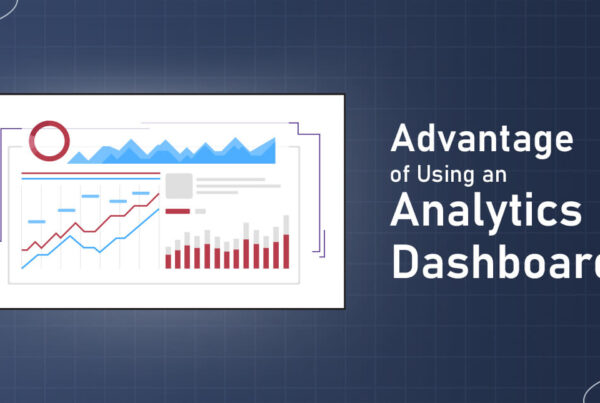
One of the best parts about using a dashboard is that it provides a quick and easy way to monitor your performance.
Instead of going through endless spreadsheets, you can get a snapshot of your data in one place. These dashboards can also identify trends and patterns that might not be immediately obvious. By visualizing your data, you can quickly spot areas that need improvement or are performing exceptionally well.
Some of the common features of dashboards include charts, graphs, and tables. These visual elements make it easier to understand complex data sets and help you make informed and better decisions.
Let’s continue to learn more about the fundamental qualities of effective analytical dashboards.
Core Characteristics of a Good Data Analytics Dashboard
When you buy vegetables, you just look for fresh, tasty, vibrant colours, firmness, and the absence of bruises. Because you don’t want your money to be wasted. As a similar dashboard works if your business mostly relies on dashboards, you have to look for the core characteristics first. Including clarity, relevance, and functionality to deliver maximum value to its users.
Now, let’s explore the core characteristics that define a high-quality dashboard:
Clarity and Simplicity
Clarity always comes from viewing the reports thoroughly with the support of bar graphs, charts, linear graphs, and scorecards. By analyzing these reports, users get a glance and instantly understand what’s happening without needing an extensive explanation.
Relevance
Each metric that is shown should be directly related to user needs or business objectives. A focused dashboard highlights a limited number of high-impact KPIs rather than packing all available data in one screen.
Real-Time Data Insights
Real-time or predictive analytics dashboards help businesses by enabling smarter, faster decision-making, improving operational efficiency, and the best part is that they reduce risks. Real-time insights are mostly helpful for e-Commerce, SaaS, or logistics, where conditions change rapidly. Users need to be certain that what they are viewing accurately depicts the organization’s present situation.
Interactivity and Customization
Users can examine insights pertinent to their context by filtering data by date range, area, team, or product type. Non-technical teams may interact with dashboards on their terms.
Consistency in Design
Consistency in design is just like a backbone. Built a design that feels effortless to users. Using common formats, color schemes, and terminology makes dashboards easier to interpret across departments.
Overall, an effective dashboard ought to be useful. Each indicator should indicate a possible course of action or choice, enabling teams to promptly address opportunities and problems.
Effective dashboards, in a nutshell, empower, guide, and inform.
Type of Data Analytics Dashboards
Numerous business purposes, each with a distinct focus and user base, can be served by data analytics dashboards. The kind of dashboard you design will rely on its function and the problem it must address, even though the fundamentals of excellent design are still the same. The most popular kinds of data analysis dashboards are listed below.
Strategic Dashboards

These are high-level dashboards mainly designed for senior leadership. They concentrate on long-term objectives and company-wide KPIs like market share, revenue growth, and customer retention.
Executives keep an eye on developments, spot trends, and decide on the company’s course with the use of strategic dashboards. They prioritize clarity over minute details and usually update daily or weekly.
Operational Dashboards

Operational dashboards are core designed for day-to-day performance monitoring. They provide real-time or almost real-time insights on ongoing operations, like call center analytics, inventory levels, order fulfillment, and website availability.
These dashboards are used by teams to promptly identify problems and maintain efficient business operations. They frequently have indicators or alerts to draw attention to irregularities or bottlenecks.
Analytical Dashboards

These dashboards are used by business analysts to explore patterns, drill into historical data, and uncover root causes. Advanced filters, breakdowns, and trend analyses are frequently included in analytical dashboards, which are more interactive and thorough.
They facilitate more thorough decision-making and strategic analysis of crucial factors, such as which marketing channels are the most economical.
Tactical Dashboards

Tactical dashboards are used by team leads and mid-level managers to monitor advancements toward departmental or team objectives. For example, a sales manager may keep an eye on lead response time, pipeline coverage, and quota attainment.
These dashboards support team-level planning and serve as a reference for weekly priorities.
Embedded Dashboards

Screens that show data and data insights within already existing applications that have been linked into are known as embedded dashboards. Although the embedded dashboard may be static, a smart embedded analytics system allows users to do more than just look.
Future of Analytics Dashboards
The future of analytics dashboards is moving forward; they aren’t relying now on traditional methods. As organizations continue to generate massive amounts of data, dashboards are evolving into intelligent decision-making ecosystems. These are powered by automation, artificial intelligence, and personalization.
Future dashboards will proactively analyse trends, predict outcomes, and provide real-time action recommendations rather than just displaying data. With sophisticated predictive and prescriptive analytics, users will not only see what occurred but also comprehend why it occurred and what should be done in the future.
As dashboards dynamically adapt to the user’s job function, decision-making style, and objectives, personalization will also be crucial in ensuring that each viewer gets only useful information.
You know what would be the biggest change? Advanced storytelling and automated narratives will make insights more understandable by communicating context, significance, and implications instead of just numbers.
Analytics dashboards are ultimately evolving into intelligent assistants that alert users to significant developments, suggest the best course of action, and occasionally take automatic action on behalf of businesses.
Conclusion
Analytics dashboards ultimately give data a voice. They make difficult things easier to understand, draw attention to what really matters, and help businesses at all levels make better decisions. Dashboards transform data into insight and understanding into action, whether they are used for long-term strategy planning or real-time activity monitoring. Dashboards that don’t just report, they predict!